Easily debug frontend code with Chrome DevTools

I am a commercial real estate professional making a career pivot & loving every second. 🏢🚀💻
As a software engineer from a non-traditional background I can help others on their journey to join the tech industry.
The scariest thing when learning how to code is running into bugs. Early on in your coding journey, even the smallest bug may seem like an insurmountable challenge.

Luckily, we have modern web browsers and tools to help us tackle these challenges. Chrome provides developer tools that allow us to easily test, debug, and fix our frontend code.
This article will introduce the basic tools that you should have in your toolbox. Later I will write an article going in-depth about how to use these tools and other advanced tactics to help you squash any bug you encounter.
To get started with learning how to use the Chrome developer tools hit F12 if you're on a Windows computer or Option + Command + i if you're on a Mac.
Element Inspector
When your developer tools first open up you should be on the elements tab. This shows you all the HTML elements that are currently on your page. This allows you to easily inspect and change things on the page.
One of the most useful tools in this tab is the magnifying glass. Once you click on this you can hover over any element on the page and the dev tools will bring its HTML code into focus in the inspector window.
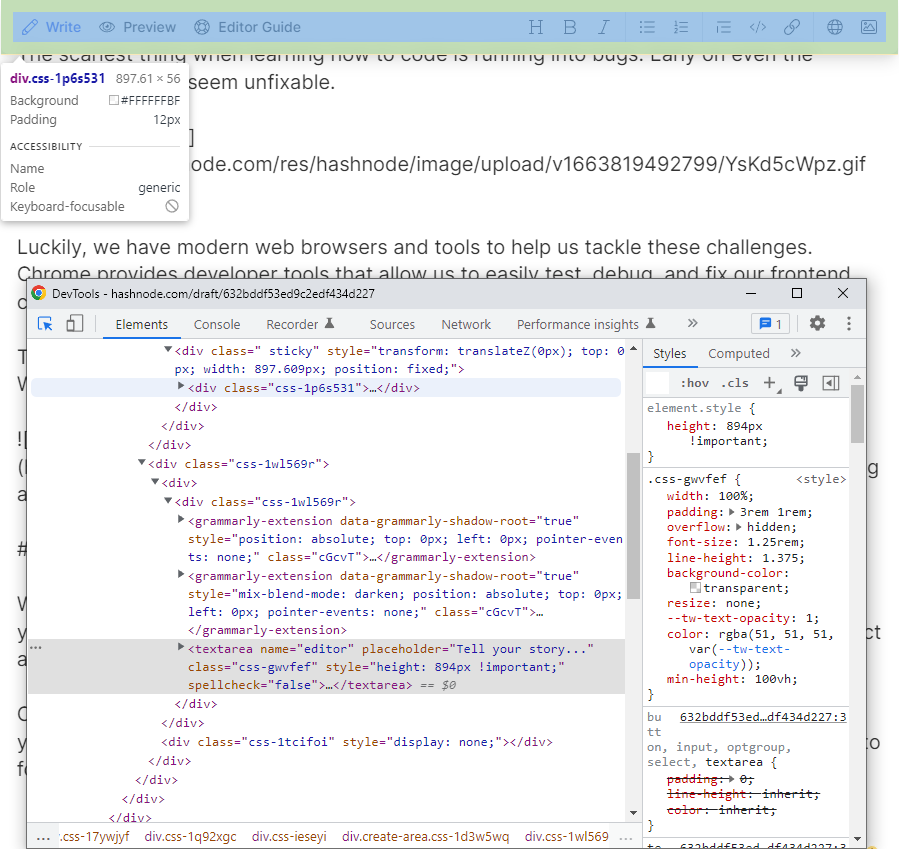
Once you are looking at an element, on the right you will see the style section. This will tell you all the styles currently affecting that HTML element. You can edit these CSS styles and they will be reflected on the page. You can also uncheck styles to deactivate them.
An easy way to preview CSS is to edit the styles of your HTML elements directly in this section. You can easily test out new styles without having to leave the page. Just remember that if you refresh the page you will lose all your progress.
Chrome has a great showcase and guide showing you everything you can do with this tool here.
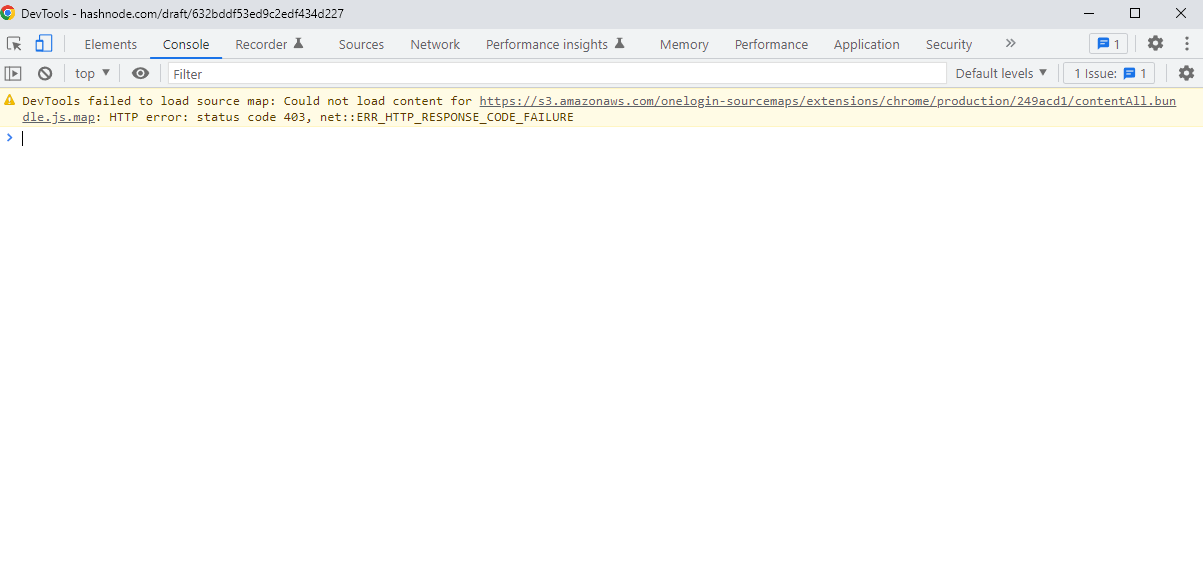
Console
Within your developer tools, you should have a console. This allows you to run code in your chrome window and allows you to interact with elements on the page.
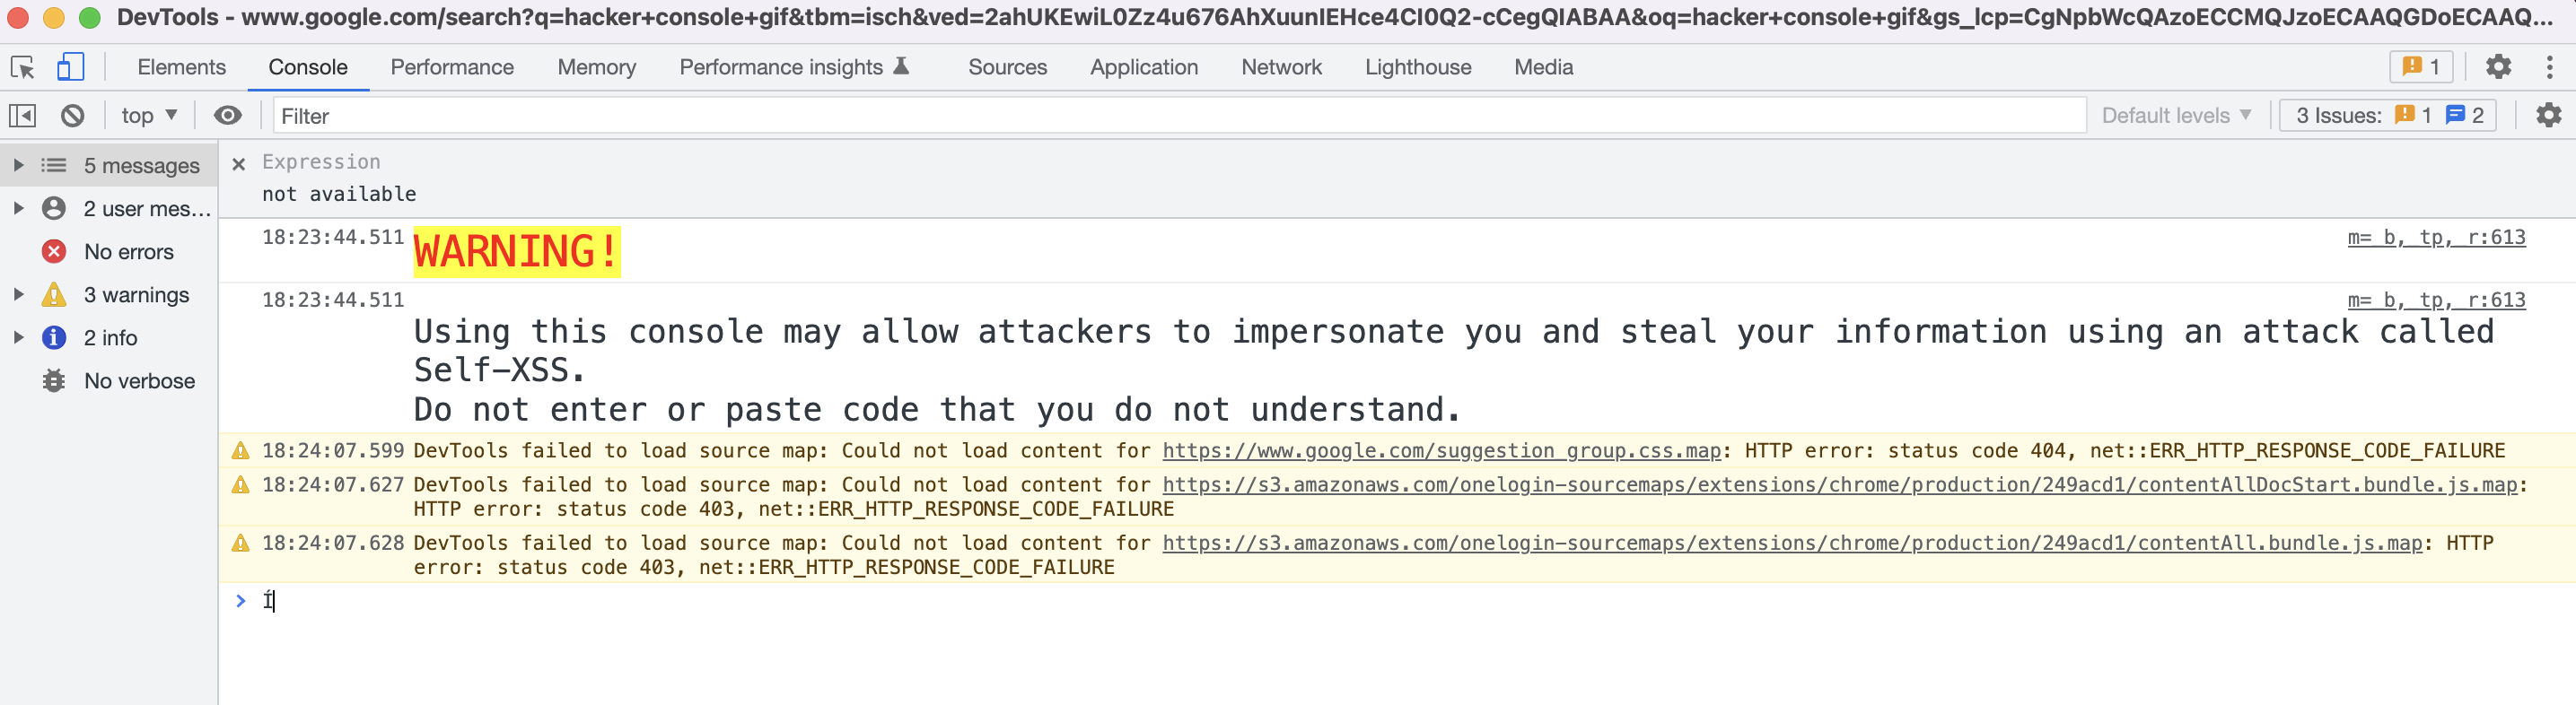
Many times you will see errors (displayed in red) pop up in this console allowing you to pinpoint exactly where something went wrong. You can also put console.log() in your code and see your logs in the console. This is useful because it can tell you if the code is getting to that point in your code. It can also tell you what is in a variable at that time.
This is great when paired with debugger which sets a breakpoint in your code. Wherever you put your debugger will stop the execution of JavaScript in your browser if you have your development tools open. Then you can do whatever you want, like viewing the contents of objects or running functions.
You can see specific examples and read more about this on the chrome developer documentation site here
Network
The network tab in the dev tools is useful for inspecting requests made to your backend. You can see the specific payloads made to your browser on page load or specific requests such as Ajax requests that are made from your browser.
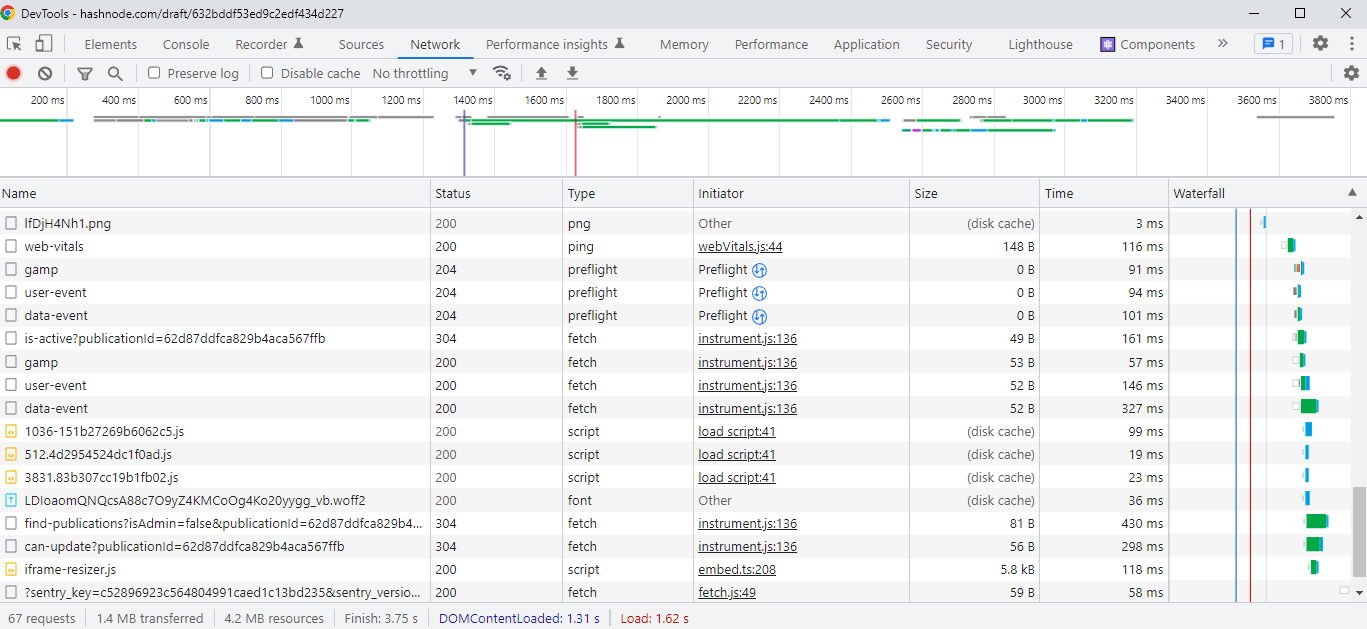
You can glean tons of information from these requests. Most importantly you should look for the HTTP method, status code, and payload.
The HTTP methods will tell you what you are attempting to do with your request. The most commonly used methods are POST, GET, PUT, PATCH, and DELETE.
A GET is used for getting data from your server, the server will usually respond with a 200 OK back with the data you requested.
A POST is used to add data to the server. This causes a change in the state or causes a side effect on the server. Once the data is added the most common response is a 201 Created.
A PUT and PATCH are both used to update existing data on the server. PATCH is different from PUT because it is used to partially update a resource on the server. The usual response is a 204.
Last DELETE is used to delete data on the server. The usual response from the server for DELETE is 204.
When using the Network tab, you can click on any request to see the request and response body of any requests which will be extremely helpful during development.
Cookies
When developing you may need to use cookies for logins, managing personalization preferences, and tracking user behavior.
You can find your cookies in the application tab in the Chrome developer tools. There you will find a table with fields for the values of a cookie.
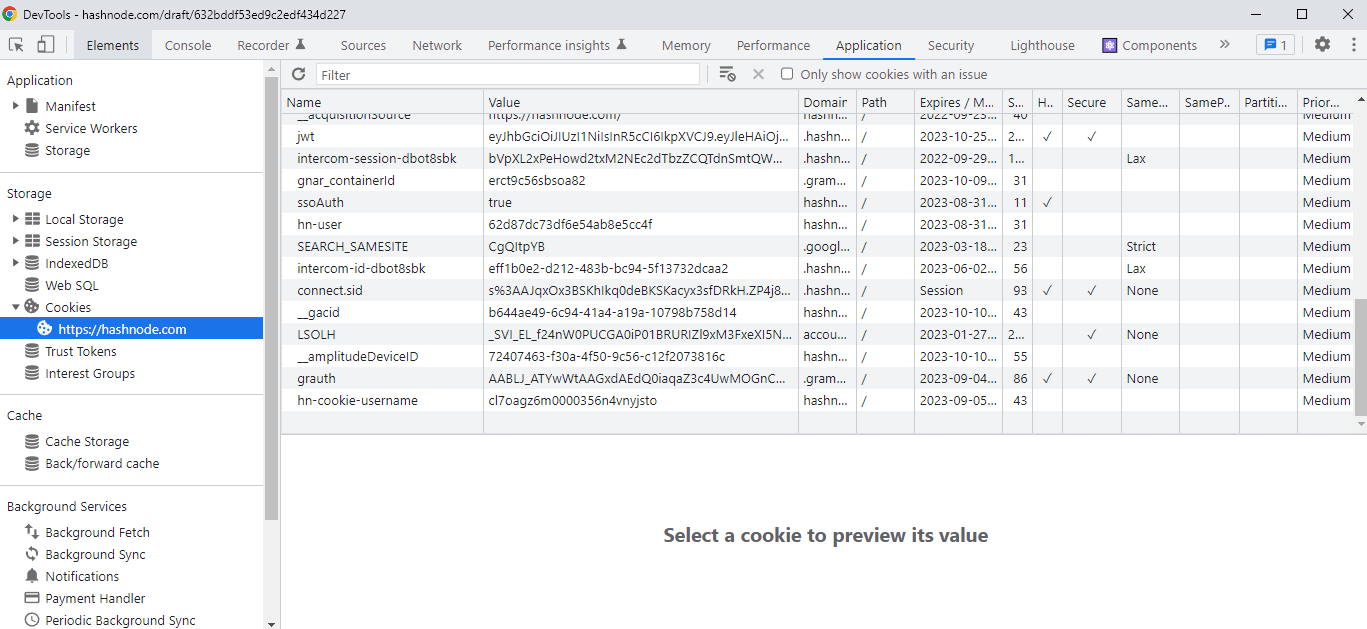
Here you can also edit cookies by double clicking them and changing the value to anything you need for testing. You can also delete them by selecting a cookie and clicking delete selected.
Conclusion
You can never experiment and truly learn how to code without failing. Learning how to debug code is one of the best ways to fully grok what you are doing and learn.
This article about frontend debugging tools is part of a series where I try to teach you everything you need to know as a software engineer to complete beginners. If you're interested in learning more check out my series here. I go over everything from setup to writing your first program and pushing it to Git!